
Data, BI & Decision Intelligence

Build the data foundation behind better decisions.

Amayztech connects fragmented operational data, builds trusted data foundations, and turns them into reporting and decision-ready insight. From integration pipelines and data warehouses to semantic models and Power BI dashboards, we design the layer between your source systems and the decisions people need to make.

  • Data architecture
  • Warehousing & lakehouse
  • Power BI
  • Reporting automation
  • Data Analytics

End-to-end data capability

From raw operational data to trusted decision-ready information.

  • Data Architecture

    Design the structure, ownership and flow of data around reporting and decision requirements.

  • Data Integration

    Connect applications, databases, files, APIs and operational systems into reliable pipelines.

  • Data Warehousing & Lakehouse

    Create governed analytical stores for cross-system reporting, history, scale and reuse.

  • Data Modeling

    Build dimensional models, semantic layers, shared measures and trusted KPI definitions.

  • BI & Reporting

    Deliver Power BI dashboards, operational reports, management reporting and drill-through analysis.

  • Decision Intelligence

    Surface trends, exceptions, bottlenecks and priorities so people can act while the information still matters.

The foundation matters

Trust the numbers before you build the dashboard.

When reporting depends on manual extracts, spreadsheets and conflicting definitions, the dashboard inherits the uncertainty.

The reporting layer can only be as reliable as the data foundation beneath it.

Where trust breaks down

  1. Fragmented sources

    Operational systems, spreadsheets and documents hold different parts of the picture.

  2. Manual reconciliation

    Teams repeatedly extract, combine and correct the same information.

  3. Conflicting measures

    Reports arrive late — and meetings become debates about which number is right.

How we start

Build only the data foundation the decision actually needs.

We start with the decisions, source systems, history, refresh needs and governance requirements. Then we choose the shortest reliable path — direct integration where it is enough, or a warehouse, lakehouse or governed data layer where scale, history and reuse require more.

No unnecessary architecture. No fragile reporting shortcuts.

The data path

The dashboard is the last mile. We build what sits behind it.

From fragmented source systems to a governed data foundation and decision-ready reporting.

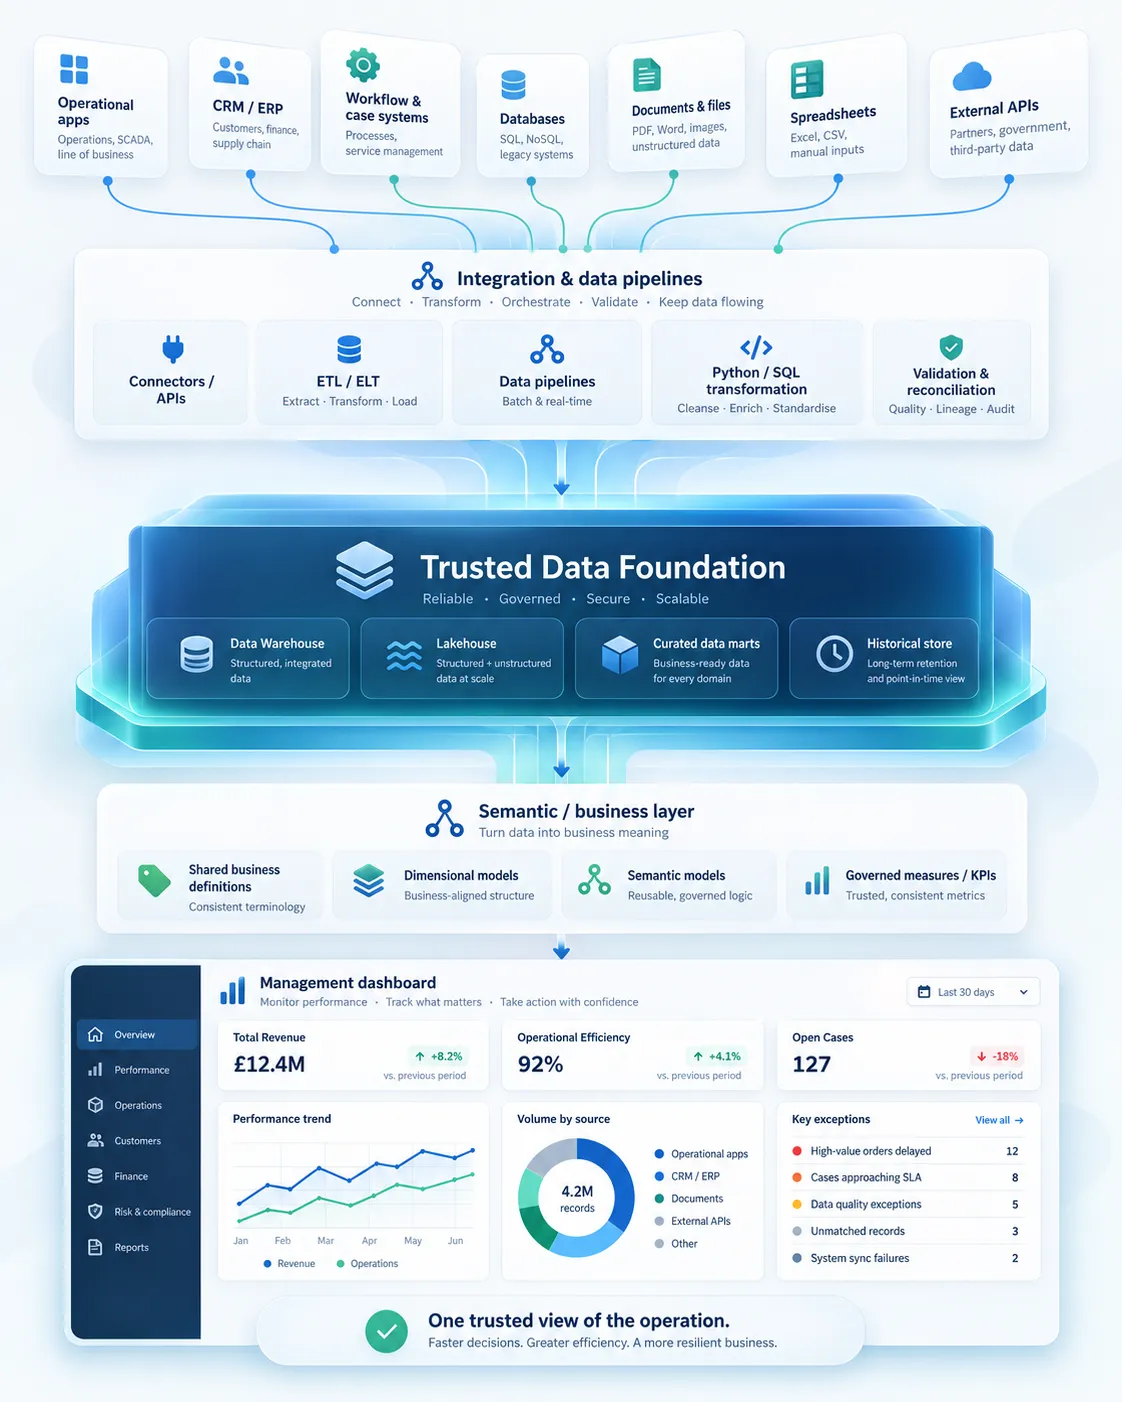
  1. Source systems

    Data starts across the applications, databases, documents and files already running the operation.

    Operational applicationsCRM / ERPWorkflow systemsDatabasesFilesAPIs

  2. Integrate & engineer

    Reliable pipelines connect, transform, validate and reconcile information across those sources.

    APIsETL / ELTData pipelinesPython / SQLValidation

  3. Build the trusted foundation

    Where history, scale, reuse or governance requires it, we establish the analytical layer behind reporting.

    Data warehouseLakehouseCurated data martsHistorical store

  4. Define the business layer

    Technical data becomes reusable business definitions, models, measures and governed KPIs.

    Dimensional modelsSemantic modelsShared definitionsKPIsAccess control

  5. Put it to work

    The trusted data layer powers the reports, dashboards, alerts and analysis people use to make decisions.

    Power BIOperational dashboardsManagement reportingAlertsAnalysis

Architecture diagram: fragmented source systems feed integration and data pipelines, which load a trusted data foundation of warehouse, lakehouse, curated marts and historical store; a semantic business layer then powers a management dashboard giving one trusted view of the operation.

What we design & build

A complete data and reporting layer — where the requirement calls for it.

  • Data Integration & Pipelines

    Connect operational applications, databases, APIs, files and third-party systems through reliable ingestion and transformation pipelines.

    • APIs & connectors
    • ETL / ELT
    • scheduled refresh
    • transformation
    • reconciliation
  • Data Warehouses & Lakehouses

    Build centralized analytical foundations that bring multiple sources together, preserve history and support governed reporting at scale.

    • warehouse design
    • lakehouse
    • star schemas
    • data marts
    • historical data
  • Data Quality & Governance

    Establish trusted definitions, validation rules, ownership and access so reports are built from data people can rely on.

    • validation
    • data quality
    • lineage / traceability
    • access control
    • KPI governance
  • Semantic Modeling & KPIs

    Turn technical data structures into reusable business measures, dimensions and definitions that reporting teams use consistently.

    • semantic models
    • DAX / measures
    • dimensional modeling
    • shared KPIs
  • BI, Dashboards & Reporting

    Build operational, management, board and regulatory reporting with the drill-through and context needed to understand what is happening.

    • Power BI
    • dashboards
    • scheduled reporting
    • drill-through
    • executive reporting
  • Decision Intelligence

    Move beyond static reporting by surfacing trends, exceptions, ageing, bottlenecks and priorities that support action.

    • exception reporting
    • trend analysis
    • operational signals
    • prioritization
    • scenario / analytical views

Technology & engineering

Built across the Microsoft data stack — with the engineering needed to connect what sits around it.

We combine BI tools with the data engineering, integration and modeling work required to make them useful in a real operating environment.

  • Microsoft Power BI

    Analytics and BI

    • Reports and dashboards
    • Semantic models
    • DAX
    • Power Query
    • Row-level security
  • Microsoft Fabric

    Integrated ingestion, engineering, warehouse/lakehouse and Power BI workloads over OneLake

    • OneLake
    • Data Factory
    • Warehouse
    • Lakehouse
    • Power BI
  • Data platforms

    • Azure SQL
    • SQL Server
  • Engineering

    • Python
    • SQL
    • REST APIs
    • Structured file ingestion
    • Data transformation / validation

Where clients already have established platforms, we can integrate with and extend the existing environment rather than forcing a replacement.

Industry use cases

Four operations, four decision surfaces

The dashboards below are synthetic examples built to show the kind of decision surface we design. The data is illustrative — the structure is how these operations actually report.

  1. Regulators & Public Authorities

    See supervisory workload, obligations and risk in one operating view.

    Supervisory data is often distributed across licensing records, filings, casework, spreadsheets and manually assembled reports. That makes basic questions about workload, ageing and attention difficult to answer quickly.

    What becomes visible

    • Licensing and case throughput by stage and age
    • Overdue filings and obligations
    • Supervisory workload, exceptions and areas requiring attention
  2. Financial Services

    Understand where applications, service cases and operational work are slowing down.

    Data can sit across core systems, workflow tools, document repositories and spreadsheets, making pipeline reporting late and cycle-time analysis difficult to trust.

    What becomes visible

    • Pipeline volume and conversion by stage
    • Processing time and ageing
    • Document blockers, SLA risk and team capacity
  3. Associations & Licensing Bodies

    See renewals, certification and member obligations before they become exceptions.

    Membership, renewal, licensing and continuing-education information often lives in separate systems and spreadsheets, limiting early visibility into lapses and incomplete requirements.

    What becomes visible

    • Renewal progress and members at risk of lapse
    • Certification and continuing-education compliance
    • Application and review throughput
  4. Professional & Legal Services

    Engagement progress is often spread across practice systems, documents, email and individual trackers, so blocked work and capacity issues surface later than they should.

    What becomes visible

    • Engagements by stage and age
    • Blocked or waiting-on-client work
    • Workload and capacity across teams

How we deliver

From data question to trusted decision layer.

  1. Define the decisions and source landscape

    Clarify the decisions, metrics, users, source systems, history, refresh needs, security and reporting obligations.

  2. Architect and connect the data

    Choose the right integration and storage pattern, then build pipelines across applications, databases, files and APIs.

  3. Model, validate and visualize

    Create trusted models and measures, reconcile against source reality, and build the reports and dashboards people actually use.

  4. Govern, enable and extend

    Document the data model, apply appropriate access controls, train the team and establish a practical path for new measures, reports and enhancements.

Why Amayztech

Why Amayztech for Data & BI

  • We work behind the dashboard.

    Integration, pipelines, warehouses, models and data quality are part of the solution when the reporting requirement needs them.

  • We understand operational data.

    We design around cases, approvals, applications, obligations, transactions, documents and the real states work moves through — not only generic executive KPIs.

  • We build for trusted definitions.

    Measures, dimensions and reporting logic are designed so different teams are not arguing over whose spreadsheet is correct.

  • We leave something your team can operate.

    Documentation, reusable models, administrative control and handover are part of the engagement rather than an afterthought.

Questions we're asked

Do we need a data warehouse?

Not always. If the reporting requirement can be served reliably from a small number of structured sources, direct integration may be the better answer. A warehouse or lakehouse becomes valuable when you need cross-system history, reusable data, stronger governance, analytical performance or a common source for many reports.

Can you build on Microsoft Fabric and Power BI?

Yes. Amayztech can design the data and reporting layer across Microsoft technologies such as Fabric, Power BI, SQL and related integration services, while connecting the operational systems around them.

Can you work with our existing databases and applications?

Yes. Most engagements start with an existing environment. We connect and extend systems where that is the practical choice rather than requiring wholesale replacement.

Our data is messy. Do we need to clean everything before we start?

No. Source quality, missing fields, inconsistent definitions and reconciliation issues are normally part of the discovery and engineering work. The important step is making those issues visible rather than hiding them inside the dashboard.

Can you migrate spreadsheet or manual reporting into Power BI?

Yes, but the goal is not simply to reproduce the spreadsheet visually. We identify the data sources, calculations and business rules behind it and automate the reporting path where practical.

How quickly can we get a first dashboard?

A focused dashboard using accessible, reasonably structured data can often be delivered in weeks. A broader warehouse, multi-system integration or governance programme depends on source complexity, history and data quality.

Can you support the platform after launch?

Yes. Engagements can include ongoing dashboard enhancement, data-pipeline support, new reporting requirements, model changes and operational support.

Start with the decision you cannot make confidently today.

Tell us which report takes too long, which numbers your teams do not trust, or which operational question your current systems cannot answer. We can work backwards from that requirement to the data, architecture and reporting layer needed to solve it.